Monthly
Real Estate INSIGHTS REPORT
One hour with a client or two hours doing graphs and numbers?
Get the Report. One more closing pays for 8 years of monthly reports (*).
This month, try them with no risk with our 30-Day Money Back Guarantee.
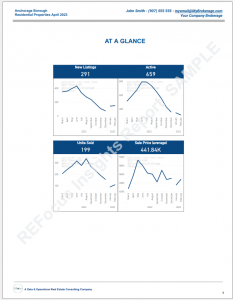
At-A-Glance
Cancel Anytime or $49 for a one-time report
CONTENTS :
- Your Branding (Monthly Subscription)
- At-A-Glance Report
- Concepts and Definitions
COVERAGE :
- One Borough
- 12 Months of Data
- Residential Market
Detailed
Cancel Anytime or $79/mo without the 1-Year Plan
- CONTENTS :
- At-A-Glance Plus:
- + Market Trends Section
- + Market Snapshot Section
COVERAGE :
- At-A-Glance Plus:
- + Three New Add-Ons
- + Increased Limit per Add-on
Save 25% and Get 30-Day Money Back Guarantee with the Yearly Plan.
Custom
Cancel Anytime or $259/mo without 1-Year Plan
CONTENTS :
- Detailed Plus:
- + Market Segment Analysis
- + Extra Tables & Graphics
COVERAGE :
- Detailed Plus:
- + One City
- + 24 Months of Data with Multi-Year Comparison
- + Residential Analysis Broken Down by
- > Single-Family
- > Multi-Family
- > Condominium
Save 20% and Get 30-Day Money Back Guarantee with the Yearly Plan.
BTP
CONTENTS :
- Custom PLUS:
- + Personal Website with
- > Online Reports
- > Interactive Reports
- + 24/7 ACCESS
- + Sharable Links
- + Multi-Year Comparison
COVERAGE :
- Custom PLUS:
- + Up to 6 Years of Data
- + Whole Alaska Available
Add-Ons
- Addl Boroughs (max. 5 add-ons)
- City or ZIP Level Analysis (max. 5 add-ons) (**)
Add-Ons
- Addl Boroughs (max. 10 add-ons)
- City or ZIP Level Analysis (max 10 add-ons) (**)
- Single-Family Analysis (***)
- Condominium Analysis (***)
- Multi-Family Analysis (***)
Available Options
- Custom Graphics and Tables
- Addl Boroughs (No Limit)
- Addl City or ZIP (No Limit)
- Addl Years of Data
- Analysis by
- _ Beds and Bathrooms and/or
- _ Price Ranges and/or
- _ Residence Area and/or
- _ Lot Area
Available Team and Brokerage packages.
(*) Calculated using a listing with a $400,000 sold price, 2.5% commission for agent the agent, 60/40 split with the brokerage, and a $59.90/mo for Detailed yearly subscription.
(**) Economy and Detailed Reports: When the Add-On “City or ZIP Level Analysis” is selected, the analysis will be done at the city or ZIP code level instead of at the Borough level.
(***) Detailed Reports: When an Add-On “Single-Family Level Analysis”, “Condominium Level Analysis” or “Multi-Family Level Analysis” is selected, the analysis will be done explicitly at that segment level instead of at the Residential level.
(#) Insights Report samples DO NOT contain real data.
Order
Now!
Payment, Conditions…
& the Small Print
Help Me Choose
Tiers’ Content, Coverages, Addl Explanations
HOW TO CHOOSE
At-A-Glance
WHAT
-
- Report with the summary of the most relevant data and analysis for the Residential market at a specific Borough.
- It offers some Add-Ons to add more locations and to allow one to zoom in to see the market at the city level.
For WHO
-
- Agents who usually request this report have up to 2 years of experience.
- They want a better-than-average idea of the market, with no specific interest in every market segment, city, or ZIP code. They may wish to request a particular city sporadically if they think a client may benefit from it, but these are exceptions.
Detailed
WHAT
-
- Report with additional data and types of analysis, still at the Residential level. However, it offers the option to break down the Residential market into condominiums, Single-Family and Multi-Familysome.
- This tier allows more details like zooming in from the Borough to the ZIP and city-level analysis with Add-Ons.
- The report can also be expanded to cover twice the At-A-Glance geography but not as much as the Custom or BTP reports.
For WHO
-
- Agents who usually request this report have over two years of experience or close over $4M/year.
- The volume and needs of clients require a higher level of market knowledge; their clients looking for a condo usually don’t accept a report that mixes mobile homes or multi-families.
- At this point in their career, they get a higher return on their time taking care of their clients and sphere of influence than dealing with tables, data, and preparing reports.
Custom
WHAT
-
- Report with the highest level of content, analysis, geography, data, and flexibility offered.
- This tier includes exclusive Add-ons and allows
– for specific requests to be addressed
– consulting time to be scheduled at a discounted rate.
For WHO
-
- Agents who usually request this report are either Top Producers or agents with moderate production who are serious about their careers or have investors with specific needs.
- The volume and needs of clients require specific market knowledge: ie:
– An investor looking for multifamily with 12 units or more within a list of ZIP codes - This report gives them access to a clientele, volume, and type of commissions to which this information opens the door.
BTP
WHAT
-
- The main difference is that it brings the report’s contents to a website and allows further explorations or customizations while making it easier for the agent and clients to access.
- The complete analysis can be done at this level while online (ie, it is not possible to open a website in a printed PDF, but it is possible online).
For WHO
-
- Agents who usually request this report seek an exclusive way to leverage data for their knowledge and clients’ experience.
- These agents desire to improve their products while becoming an expert in the sector.
COST, PAYMENT, CONDITIONS & THE SMALL PRINT
Conditions First Time Customer
FIRST TIME CUSTOMER
- In order to set up the account on time and be able to receive the FIRST report, the following has to be completed :
- Provide complete contact information and details: full name, email address, phone number, Licensee or Broker number, Brokerage name, and logo
- Purchasing of the Tier and Add-ons (if add-on city for example, then specify the city
- Full payment of the monthly cost of the report, add-ons, and the set-up fee
The account setup may need between ten to fifteen days.
Reports are emailed to the address provided while setting up the account.
Reports are in PDF (download Adobe free viewer here)
FIRST TIME CUSTOMER definition: Account that is to receive a monthly report that was not receiving a report the previous month.
Conditions Existing Customer
- Reports are emailed to the address provided while setting up the account.
- Reports are in PDF (download Adobe free viewer here)
EXISTING CUSTOMER
- No commitment. No need for it next month? No problem: just let us know before the 1st of the month (so we don’t create your report that month).
- Reports will be emailed on the first Monday of each month.
- Include or remove Add-Ons as you need them.
- Economy and Detailed: No charge if you let us know before the 15th of the month so that we can build the report on time to plug in the data at the end of the month. Otherwise, the rush order costs $79.
- Custom: No charge if you let us know 30 days in advance so that we can build the report on time to plug in the data at the end of the next month. Otherwise, the rush order costs $179.
Costs and Payment
- Set-up: NO COST.
- Monthly payments will be triggered on the 1st of every month for the same amount as the previous monthly payment unless otherwise communicated in writing.
- Include or remove Add-Ons as you need them. COST:
– $0: No charge as long as you let us know before the 15th of the month (we need to prepare and build your report in time to plug in the data at the end of the month).
– $79 if the request is received AFTER the 15th of the month.
Length of Subscription & Cancelation Policy
MONTHLY CONTRACT:
Short version: cancel anytime. That’s it.
Longe version: If the payment went through, we produce the report. If it didn’t go through, we don’t produce the report.
And no questions asked (although we always appreciate feedback!)
YEARLY CONTRACT:
The Yearly Contract offers a steep discount but comes with a commitment; no cancelation or refund is available.
Price Changes
Prices can be locked in for 12 months under a Yearly Plan. Please contact us for additional details.
Returns / Refunds
Refunds can be done as long as the Report that corresponds to the payment requested to be refunded has not been emailed to the customer.
30-Day Money Back Guarantee
Small Print
CONTENTS
Your Branding
At-A-Glance Report
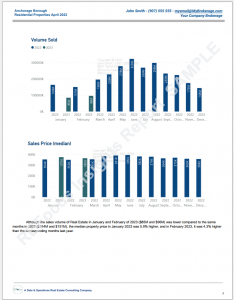
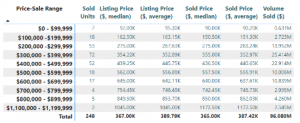
With over 14 graphics and tables, it covers New Listings, Active, Pending, and Sold properties, diving into the number of units, prices, Days on Market, Rate of Absorption, etc.
Useful to have the most recent market data without spending hours in front of Excel creating graphics. The report is an impressive document to print and bring to your clients’ appointments to educate them or help them set property expectations.
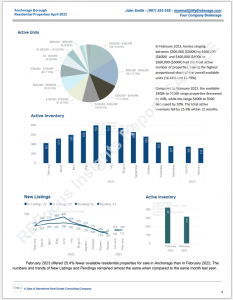
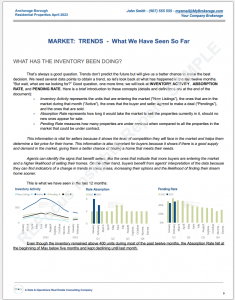
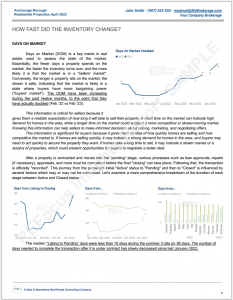
Market Trends Section
The way it is presented, with its additional 10 graphics and tables, helps obtain a high-level point of view of the market. Explanations have been added so your clients can easily follow the report, and see how data supports your advice and recommendations.
Seeing the graphics, trends, and tables from the last twelve months answers the question “how do you know that?” without them even asking it! And does it elegantly with objective data.
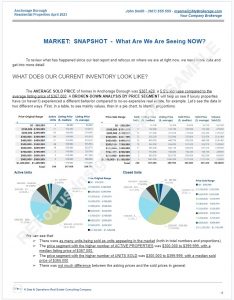
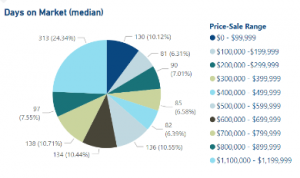
Market Snapshot Section
It reviews INVENTORY ACTIVITY, ABSORPTION RATE, PENDING RATE with additional analysis, with PRICE RANGE studies. In addition to that, it has a section that discusses how the features in the listing have affected the price and the speed at which the property has sold. We are getting into the top producers’ and nerds’ zone here.
Even though the density of the report is higher than the At-A-Glance and the Market Trends Section, abundant explanations and comments have been added so your clients can still follow the report, and see how data supports your advice and recommendations (most likely tremendously appreciate this point).
We strongly recommend combining this Add-On with the Marlet Trend Section when ordering the Detailed tier report. Not just because you will impress your clients with a 22-page report, but because both together provide a complete analysis of the market: the Market Trend presents and reviews the last 12 months, and the Market Snapshot zooms in and expands the last month’s activity.
Concepts and Definitions
And since not everyone is a math guru, this section comes with statistics terms and parameters definitions. It even has interpretations and examples!
COVERAGE
Geography: Borough, City and ZIP
What is the difference between each analysis?
– If it is at the Borough level, then the report summarizes the stats for the cities and ZIP codes within that Borough.
For example, the Matanuska Susitna Borough includes the cities of Wasilla, Palmer, Big Lake, Talkeetna, Sutton, Houston, Glenallen, and Willow.
– if it is at the city level, then the report summarizes the stats for all the ZIP codes within that city.
– if the coverage level chosen is ZIP, then the report will show the stats for that ZIP only.
By default, the Economy and Detailed reports cover the Borough level. Include the proper Add-On that comes within each tier to zoom in on your analysis, and get the specific city or ZIP code stats instead of the Borough ones.
Timeframe
By default, the Economy and Detailed reports cover that, a period of 12 months, in the tables and graphics that are appropriate. The Custom tier covers 12 additional months, so a total of 24 months are considered in the report.
What if I want to consider 5 years? That can be done too! That is a pretty impressive level of analysis and market knowledge. The tier that allows that level of detail is Custom.
Market Segment
The Residential segment of Real Estate can be formally broken down into the following subsegments:
- Single-Family
- Condominium
- Multi-Family
- Mobile-Homes
(We will eventually add Land if there is demand for that type of report).
By default, the Economy and Detailed reports provide stats on the Residential segment as a whole. What if I want the stats for one of the four subsegments listed above? you may ask. Easy:
- OPTION A) Choose the Detailed tier, then include the proper Add-On.
- OPTION B) Choose the Custom tier; it comes with the broken-down analysis of ALL of them already included.
Custom Tier Available Analysis
To be honest, even though we may be going against common practices of marketing and sales, we have to say that it is not recommended unless it is needed and the agent/brokerage has experience. The amount of data and the depth of analysis is considerable. However… top producers and experienced agents do need that level of insight, and certain clients do demand that level of knowledge of the market.
About the Available Options in that tier:
Some of them asked if we could provide an even more detailed analysis. Basically, if we could custom the Custom report (yes, they did). We responded “Yes”, and we produced the available options in that tier, to cover specific demands, and to provide VIP clients with a fully customized report.
“What type of questions are these folks asking that need that type of report??” you may ask. One of them was: “What can you tell me about properties with 4 or more bedrooms, at least 3 bathrooms, in a house within 3,000 to 4,000 sq.ft., in Eagle River and Girdwood (without mixing the stats), with a lot bigger than 3/4 of an acre (but smaller than 2 acres!), that have at least 3 car garage? and with a price between $1M and $3M? and can you go back 5 years to see what has happened too?. Tks!”
We do have a limited amount of reports we can produce at that level, so please consult availability. We will be adding capacity soon!
Frequently Asked Questions
DO I OWN THE REPORT?
The report will be customized with the name, contact information, and logo that were provided during the account setup process. It’s possible that the name on the report may not match the name of the subscriber, but we may ask for confirmation to ensure accuracy. If you have any questions about ownership of the report, please don’t hesitate to reach out to us for clarification.
CAN THE REPORT BE SHARED?
However, it is important to consider whether sharing the information contained in the report with other agents is in the agent’s best interest. While the report will include the agent’s name, contact information, and logo, which could be beneficial for marketing purposes and gain referrals, the data within the report could also be considered an agent’s ‘secret sauce’. A ‘secret sauce’ which is also not freely available (a subscription is paid in order to obtain the report). It is up to the agent’s discretion whether or not to share the report with others.
CAN THE INSIGHTS REPORTS BE CONSIDERED AS A WAY TO PREDICT THE FUTURE?
REFocus conducts this type of study and can provide consultation on it, but the reports themselves do not include any predictions or comments regarding future trends.
WHAT FORMAT DOES THE REPORT HAVE?
WHEN AND HOW SHOULD I EXPECT THE REPORT?
They will arrive as a document attached (PDF).
HOW ACCURATE IS THE DATA?
However, it’s important to note that the Reports do not represent all Real Estate activity that happens in Alaska, as some transactions may not be made public or passed via MLS.
Additionally, errors may occur due to the human component involved in the data collection process. Disclaimers such as “All square footages are approximations,” “Buyer to verify all the information,” and “Information is not guaranteed and should be independently verified for accuracy” are common in the industry.
Despite this, the quality of the data and analysis done to produce the Reports is as accurate as possible with the available data.
ARE THERE PACKAGES FOR TEAM LEADS AND/OR BROKERAGES?
To learn more about these packages and to discuss your specific needs and conditions, please contact us. We will be happy to work with you to find a tailored solution for delivering the Insights Report’s content.
If I cancel and I want to receive the reports again, do I have to pay the New Customer Set Up Fee?
It takes the same effort and time to build an account for someone the first time ever, as it takes to build it again after it was deleted.
Contact Us
Have additional questions? Send us an email and we will reach back to help you answer them!